

July 2022 - Current

May 2021 - May 2022

July 2020 - May 2021
Oct 2020 - May 2021

Analyzing and automating your processes, ensuring that you always have the information you need.
Toolbox: Power Bi, Python, Power Query, Excel.

Developing robust and secure backends that communicate seemlesly with beautiful and responsive websites.
Toolbox: Django, React, Docker, Azure.

Managing your databases and ensuring that your information is always available and secure.
Toolbox: MySQL, NoSQL, AWS, Pentaho
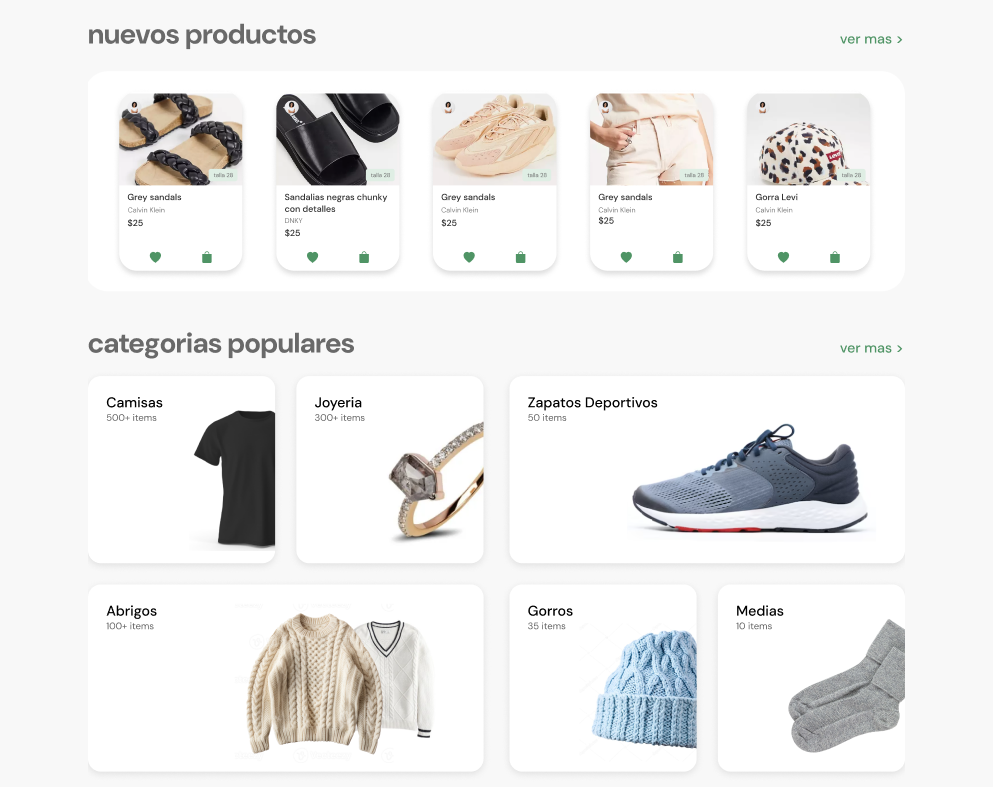
UI design an online thrifting platform (personal project).
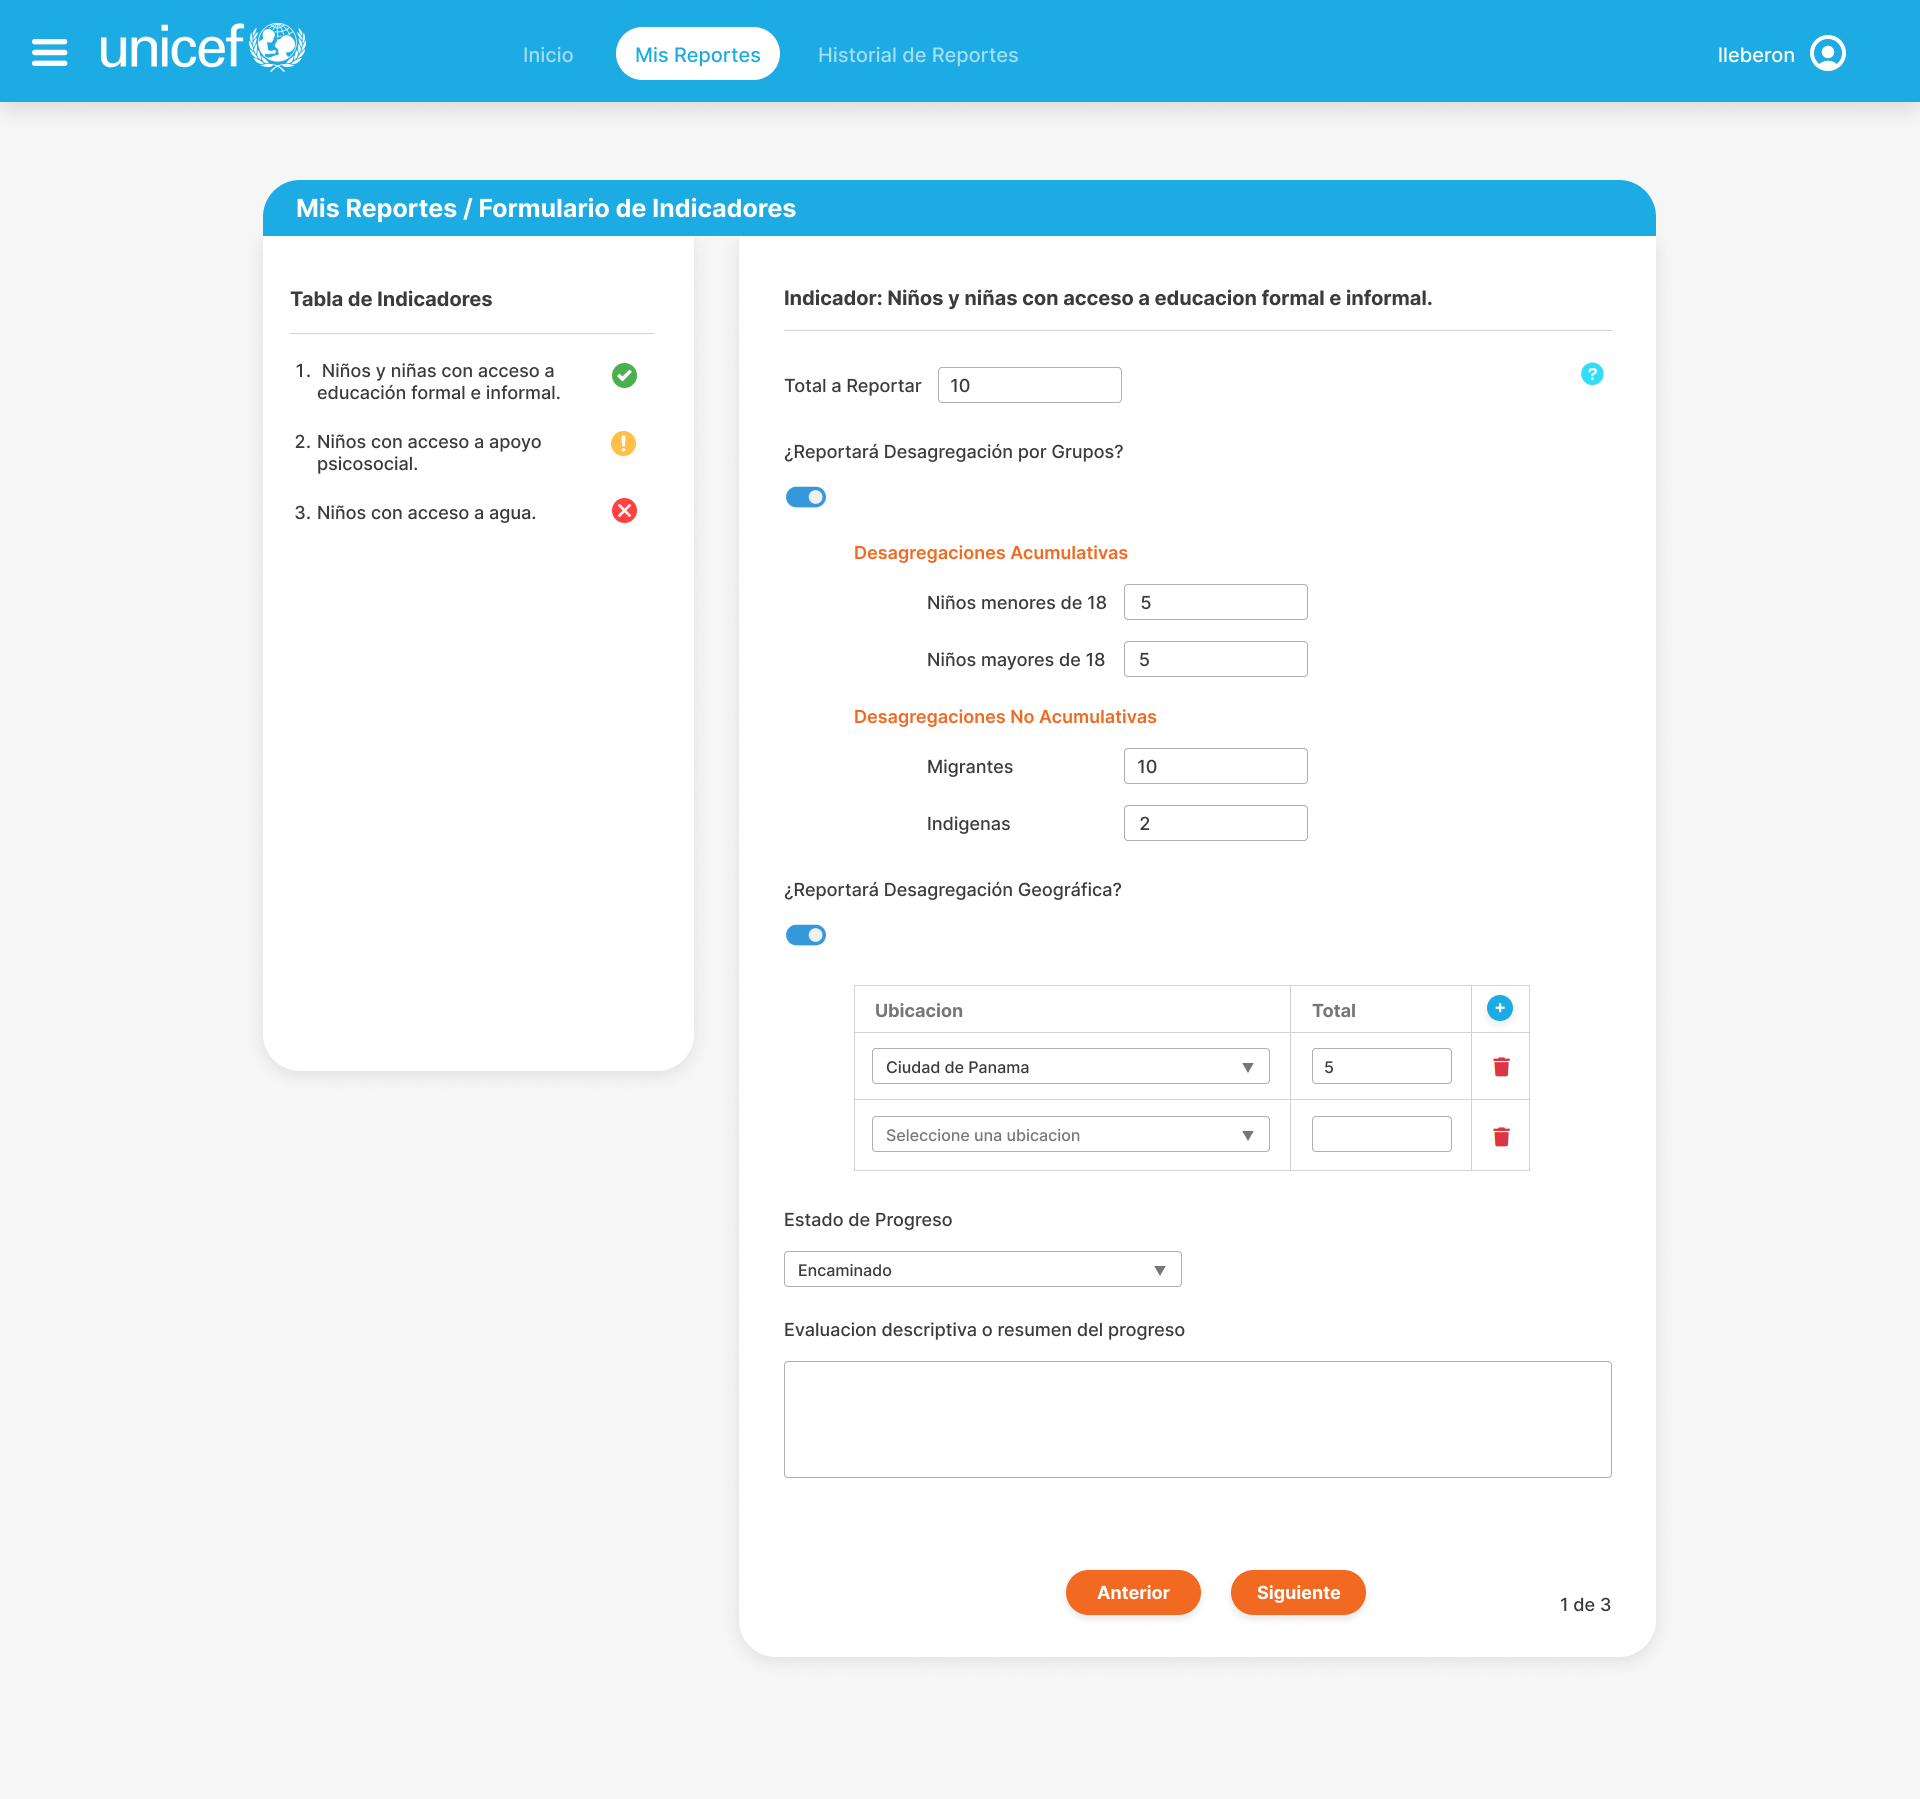
Regional data collection platform design for UNICEF Latin America and Caribbean
Landing page design for an IT consultancy firm.
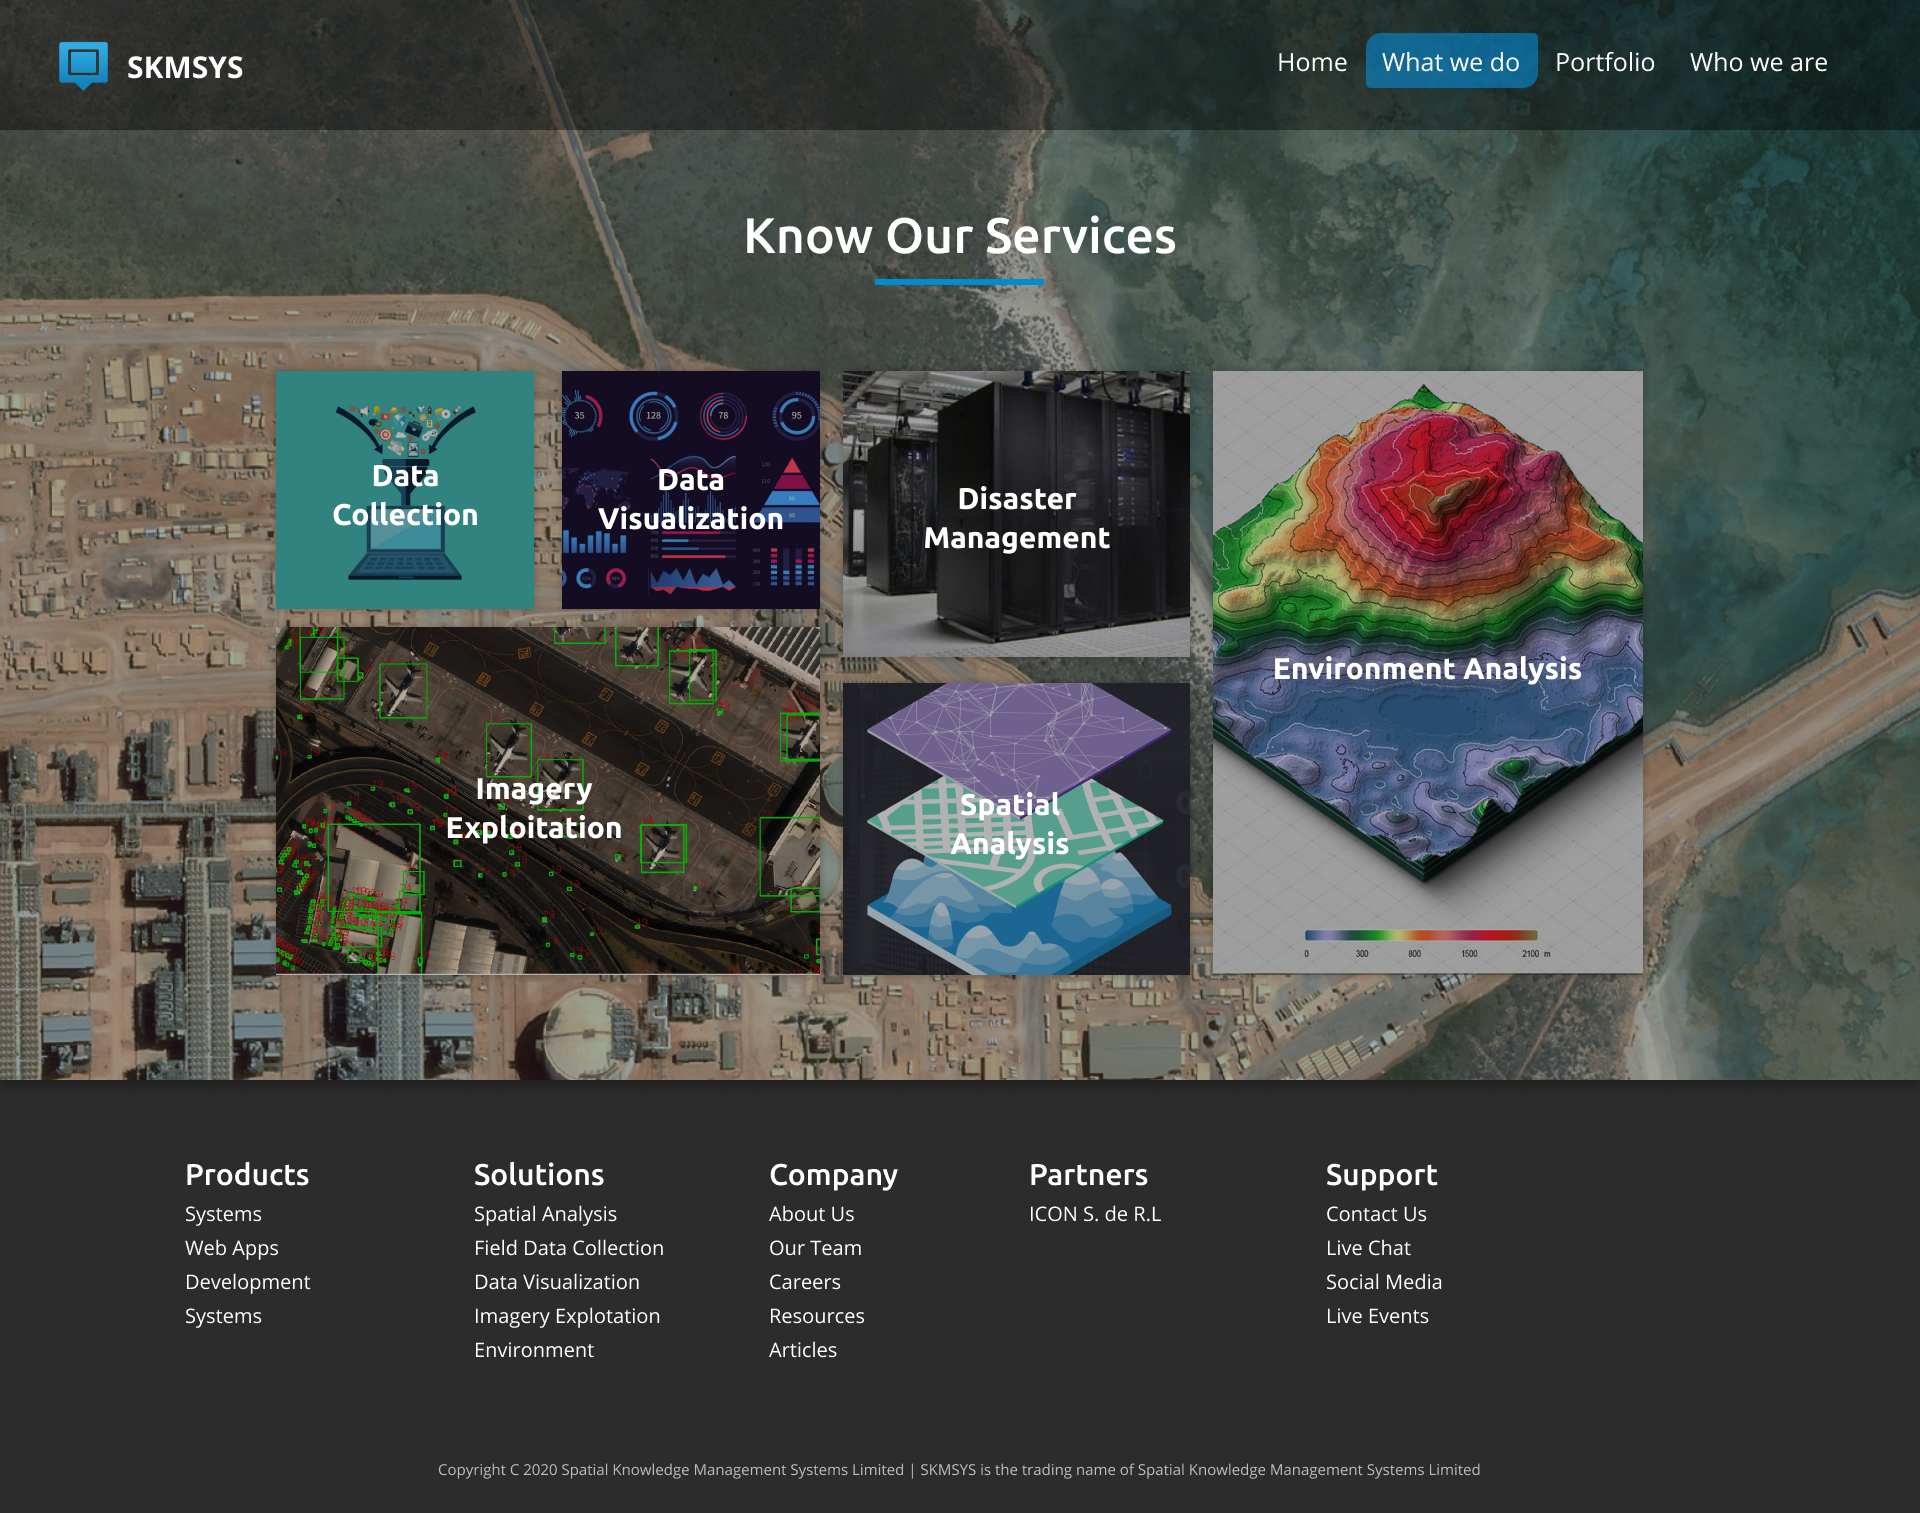
Website redisign for geographical technology integration company.
Logo designed for a data analytics company.

Logo design for an IT consultancy firm.

Logo design for a daycare.
Logo design for an electrical engineering lab.

Logo design for an online liquor store.
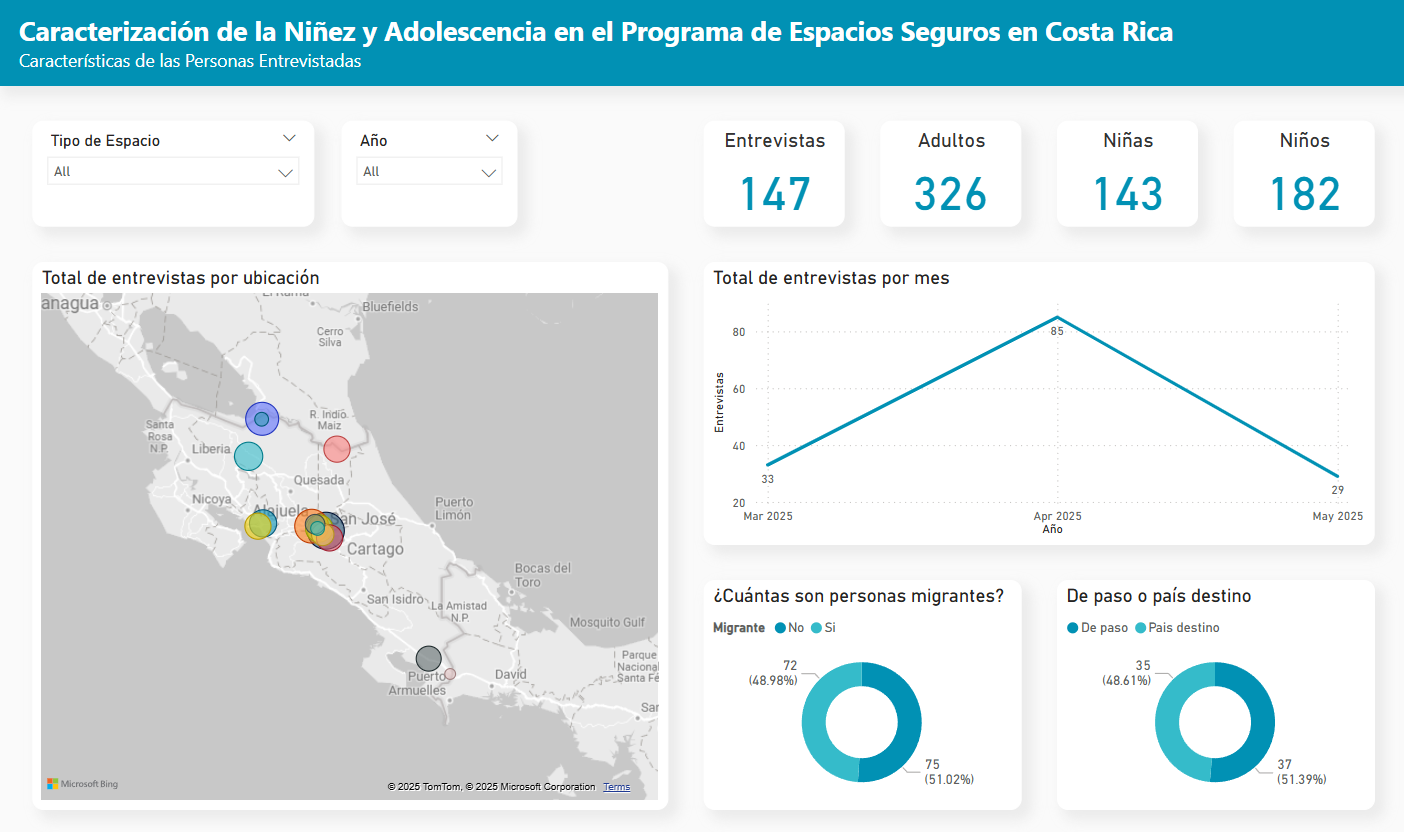
Dashboard created to analyze migration transit and related activities in multiple regions.
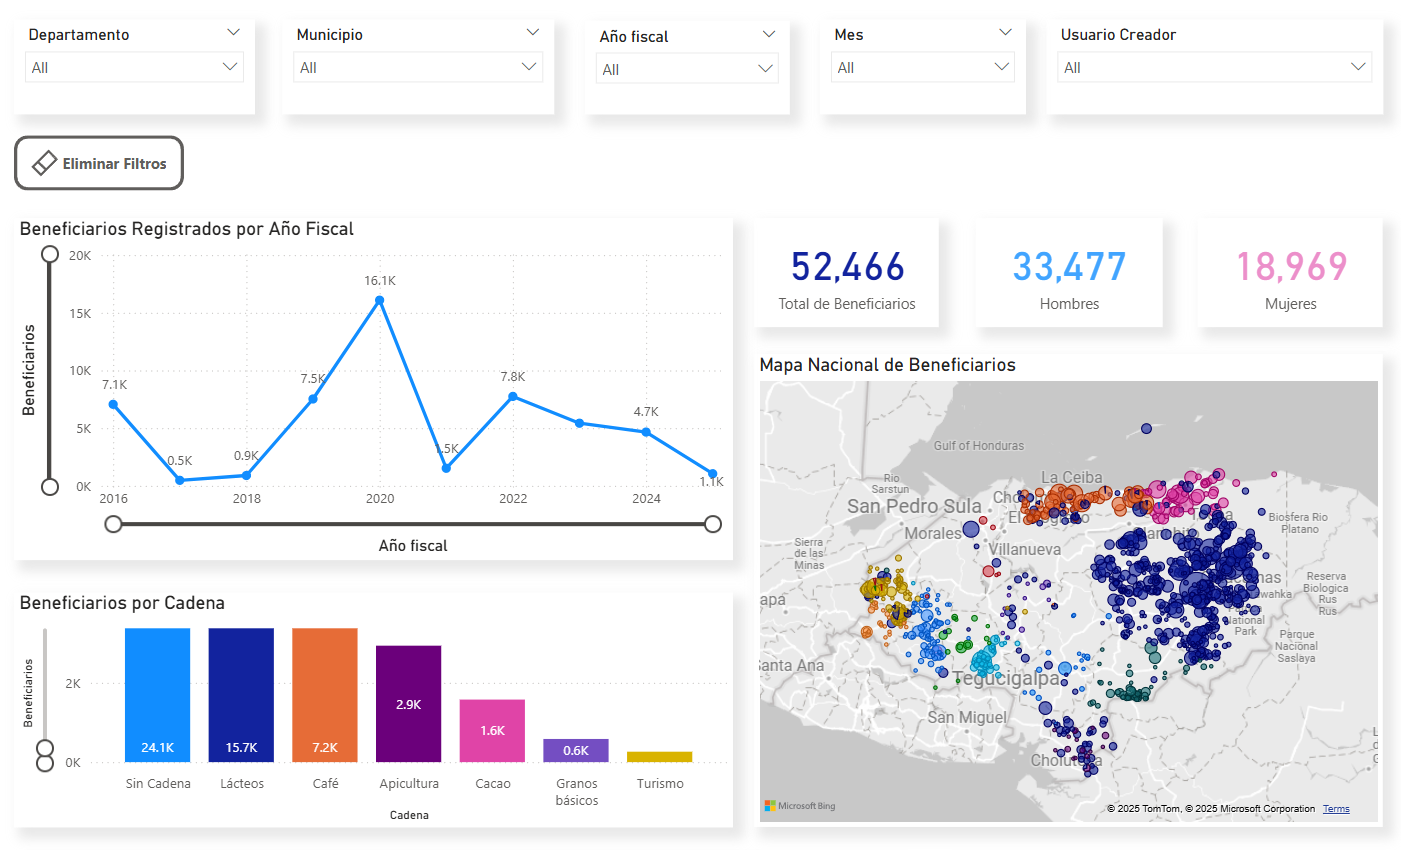
Dashboard created to analyze beneficiary distribution and demographic data.
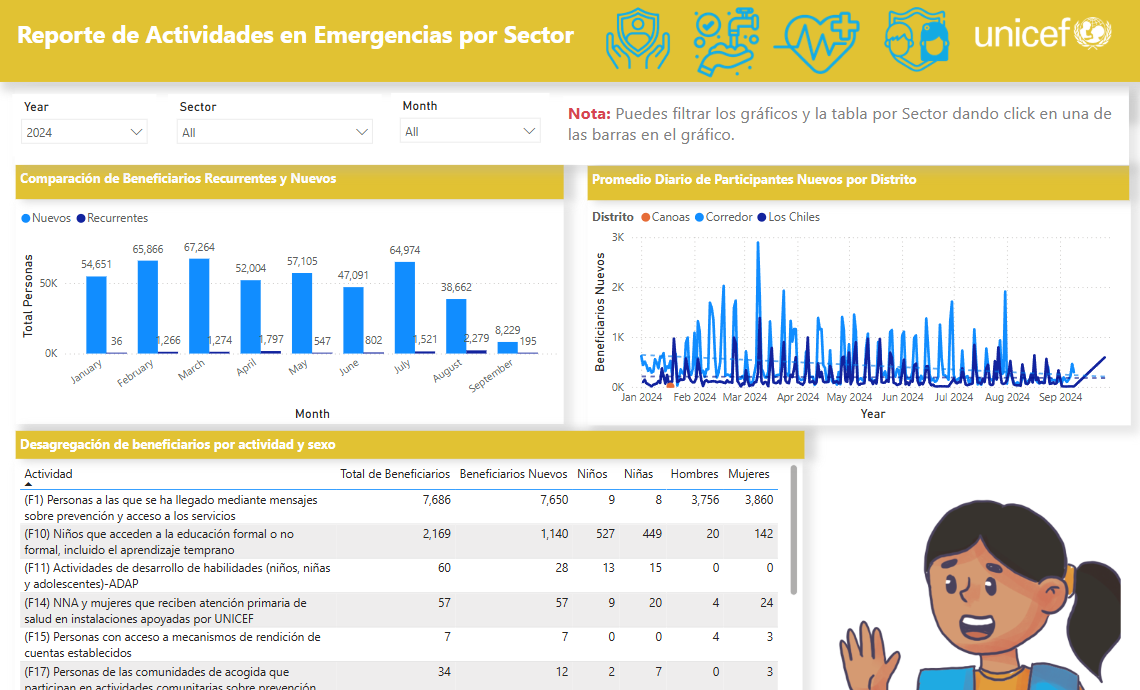
Dashboard created to analyze activity data delivered in multiple regions.
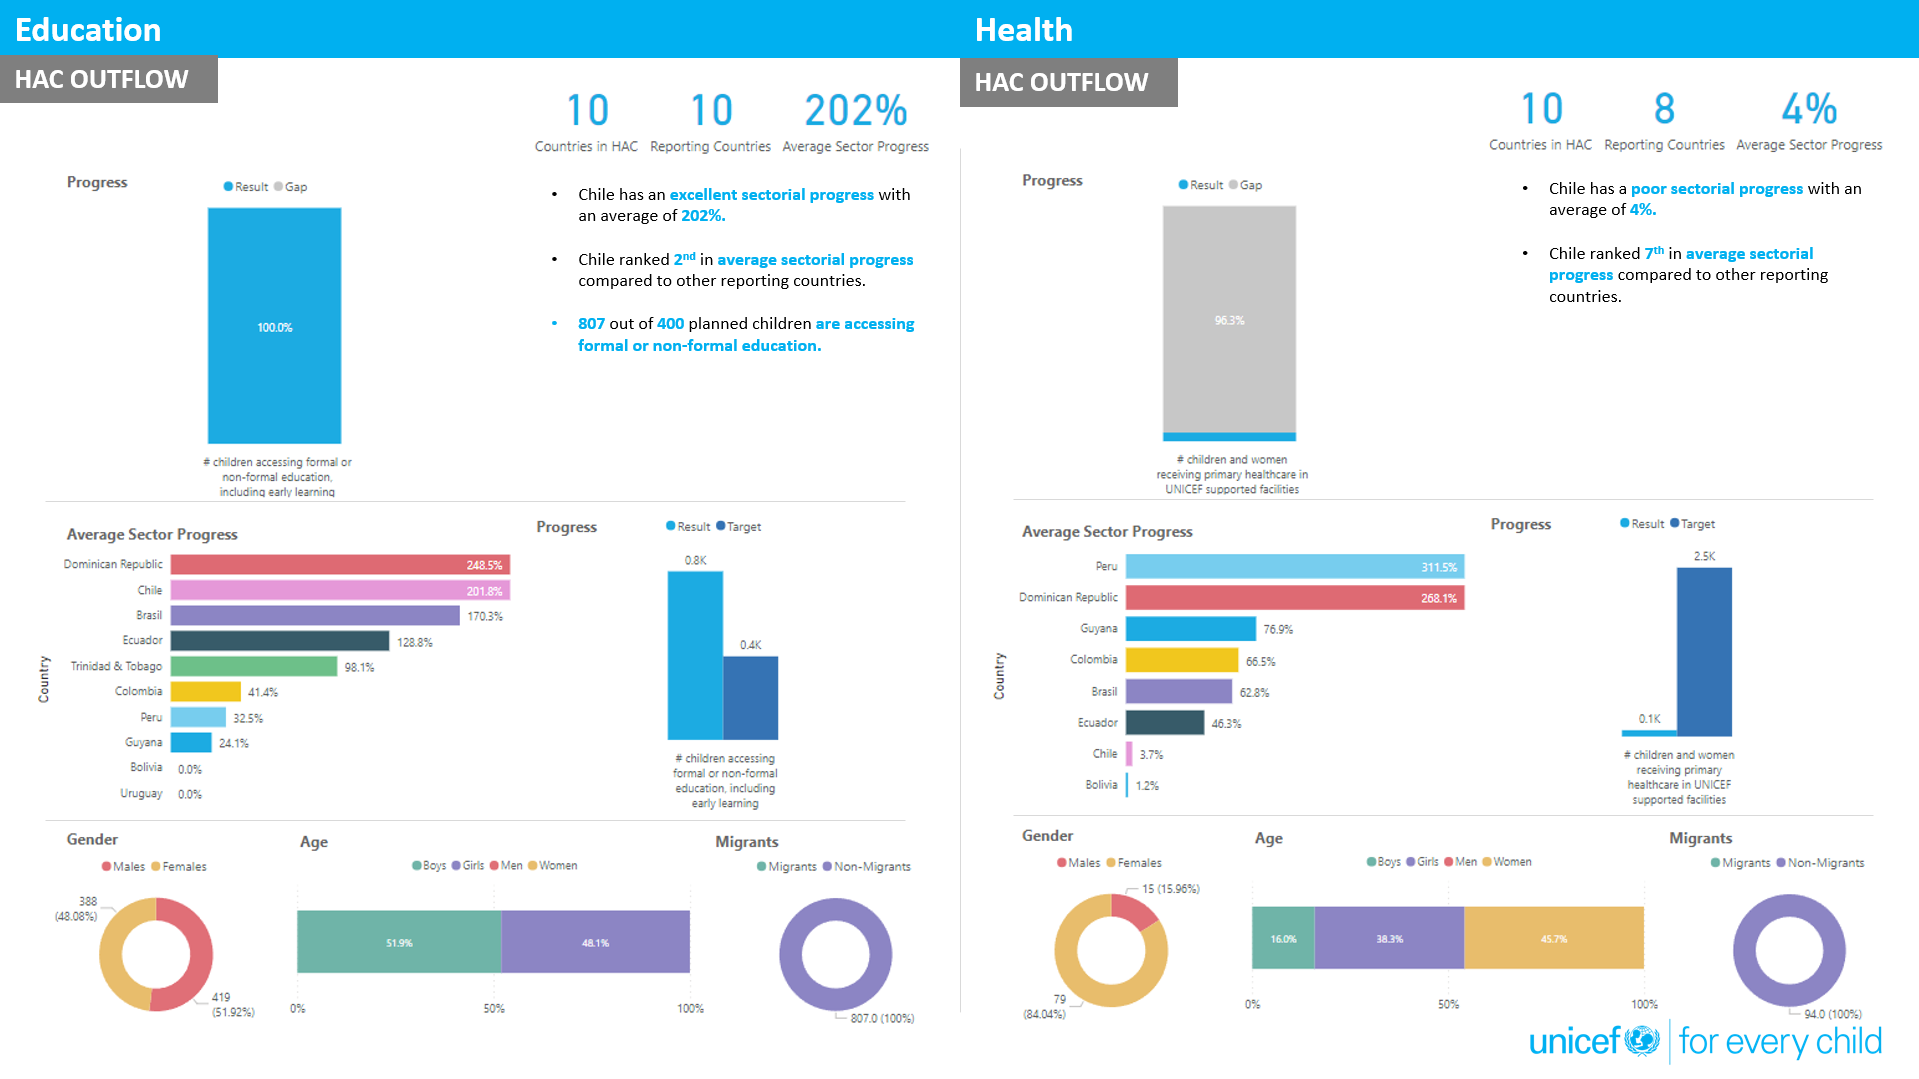
Dashboard created to analyze multi-sectorial results.
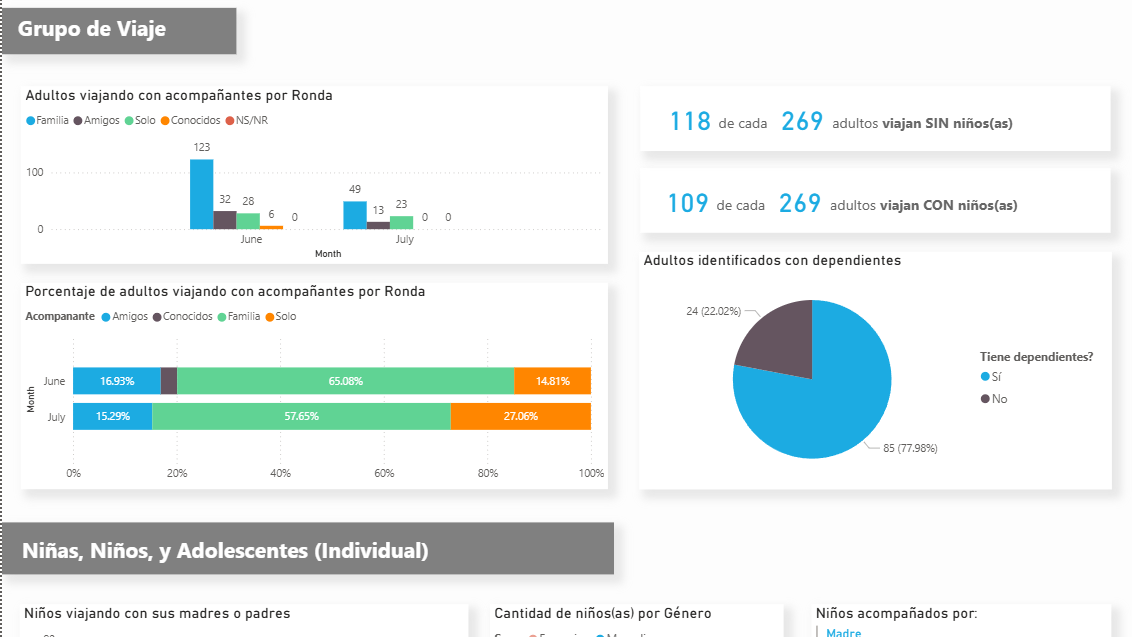
Dashboard created to analyze travel group in transit data for child protection sector.
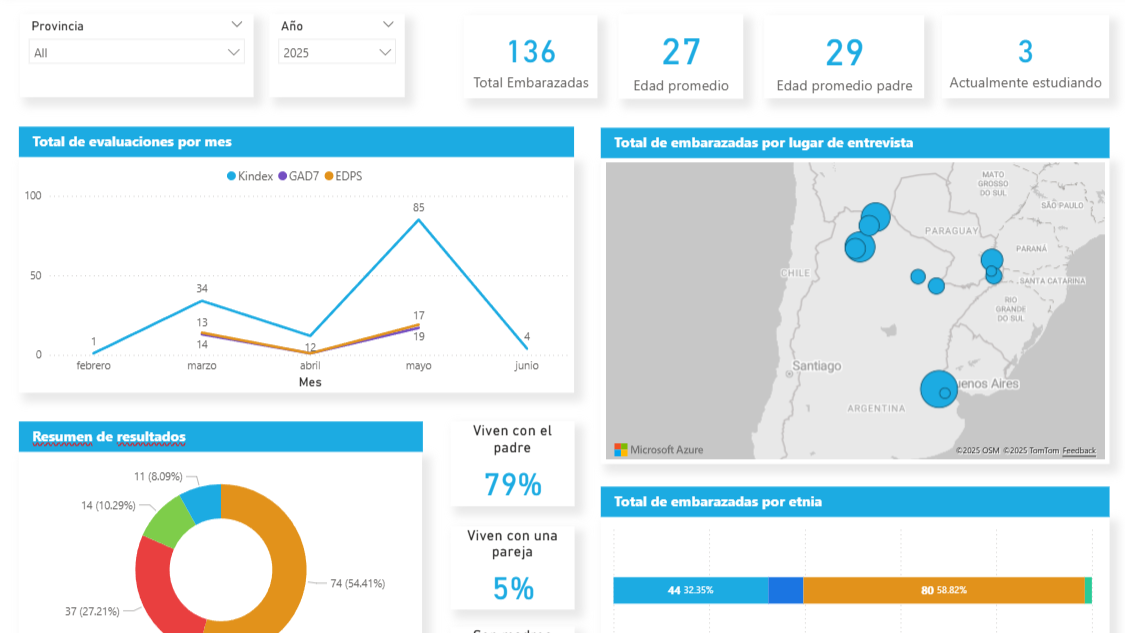
Dashboard created to analyze mental and physical health data for pregnant girls and women.
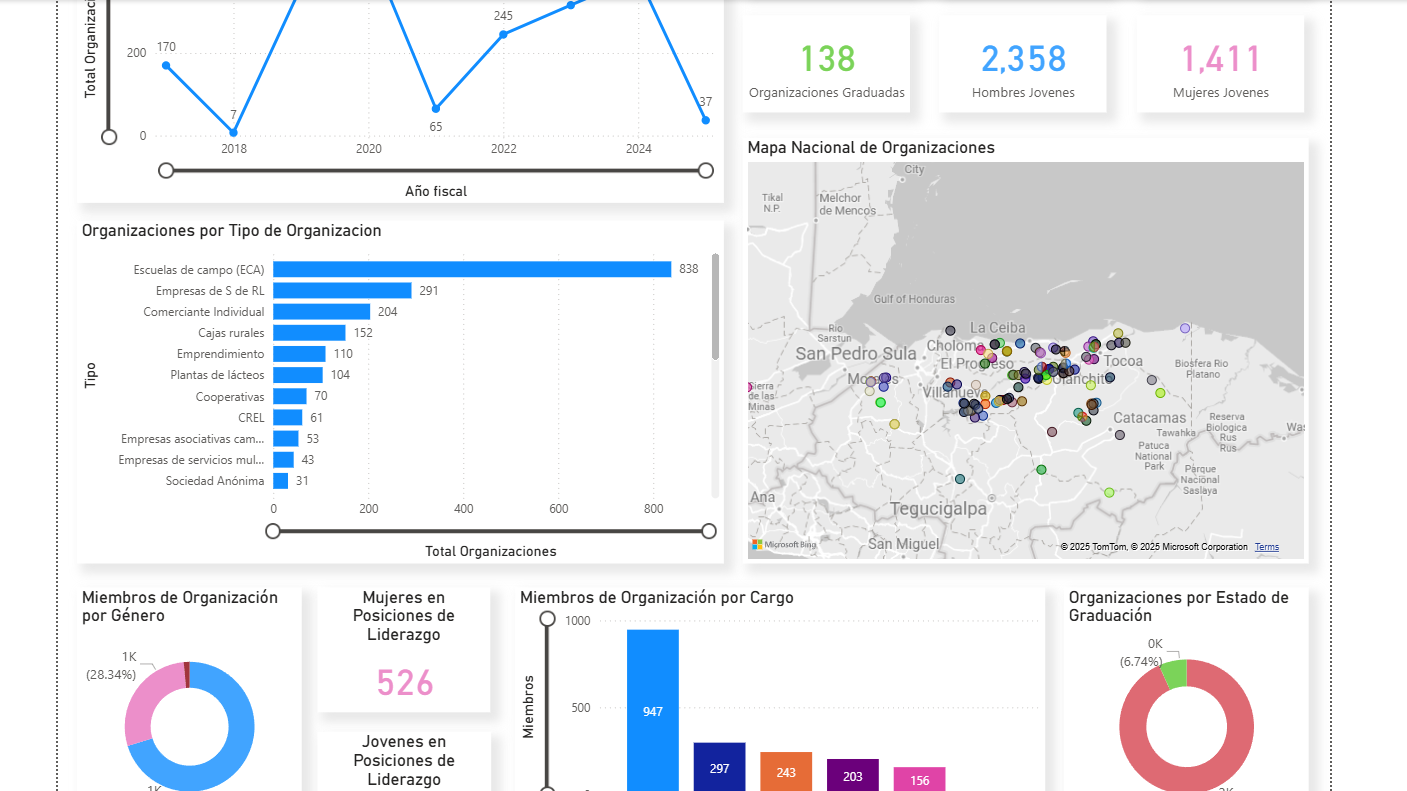
Dashboard created to analyze multiple organization data in the region.

Video created to showcase yearly sectorial results.
Video created to showcase multiple country improvements.
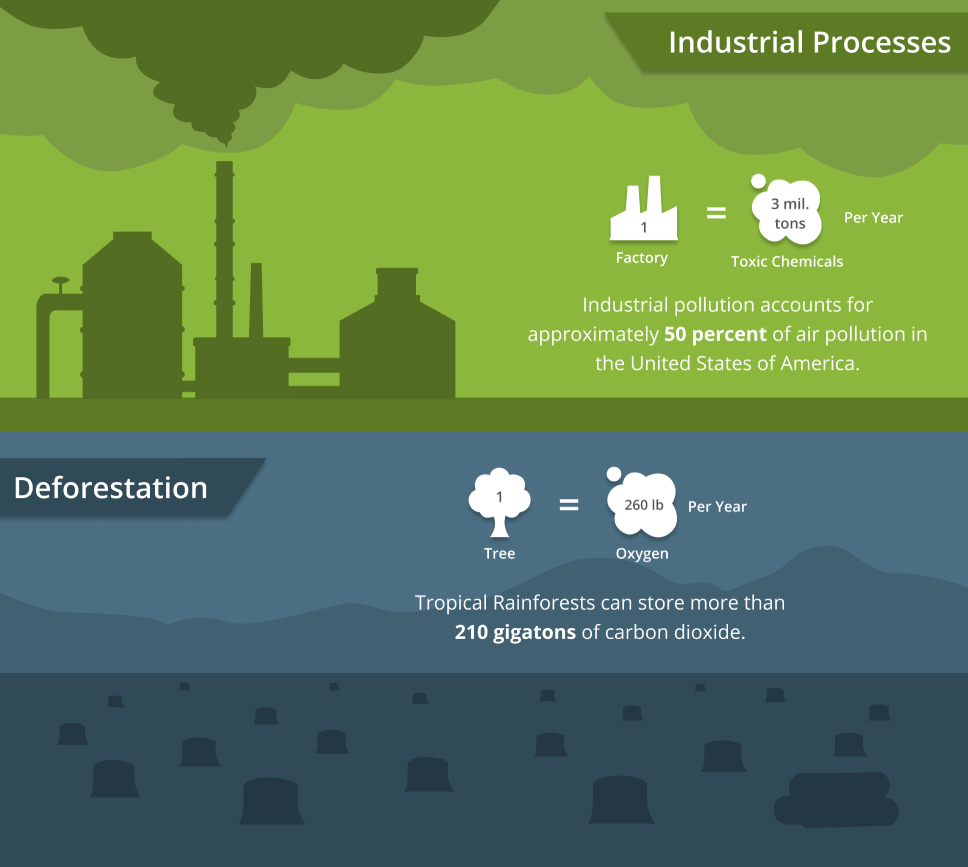
Infographic made for a climate change campaign.


